Is Your Watchlist Full of Losers in Disguise? The Hidden Risk of Relative Weakness
Is your watchlist hiding losers in disguise? Learn why relative weakness kills returns — and how AIStockTickers ranks stocks daily by strength & filters risk.
Is Your Watchlist Full of Losers in Disguise? The Hidden Risk of Relative Weakness
You’ve probably done it: held onto a stock that’s quietly underperforming the market for months (or longer), telling yourself “it’ll come back” or “it’s a great company long-term.”
Meanwhile, the broader market or its sector surges ahead, and your position drags your portfolio down.
That’s the danger of relative weakness — and it’s one of the most common (and costly) mistakes investors make.
What Is Relative Strength — And Why Does It Matter?
Relative strength (RS) measures how a stock performs compared to a benchmark like the S&P 500 or its own sector index.
- A stock with strong relative strength outperforms the market/sector during uptrends and holds up better (or falls less) during corrections.
- A stock with weak relative strength lags behind — even if it’s not dropping dramatically in absolute terms.
Historical data shows that stocks with superior relative strength tend to continue outperforming in bull markets, while laggards often keep lagging. Roughly 75% of a stock’s price movement correlates with the broad market, so ignoring RS means you’re fighting an uphill battle most of the time.
The Behavioral Trap: Holding Underperformers Way Too Long
Thanks to classic behavioral biases (especially the disposition effect and loss aversion), most retail investors do the opposite of what works:
- They sell winners early (locking in gains feels good).
- They hold losers far too long (hoping to “break even” and avoid realizing the pain of a loss).
Loss aversion makes losses feel about twice as painful as equivalent gains feel good. So instead of cutting a weak stock and rotating into stronger performers, people cling to underperformers — often watching them drift sideways or worse while stronger names run away.
The result? Portfolios stuffed with “losers in disguise” that quietly erode returns, even in rising markets.
How AIStockTickers Eliminates the Guesswork
Our AI doesn’t rely on hope, stories, or emotional attachment.
Every night, it scans the entire U.S. market and ranks stocks by relative strength against both the broad market (S&P 500) and their specific sector — combined with dozens of other objective factors like momentum, volume, earnings trends, and technical quality.
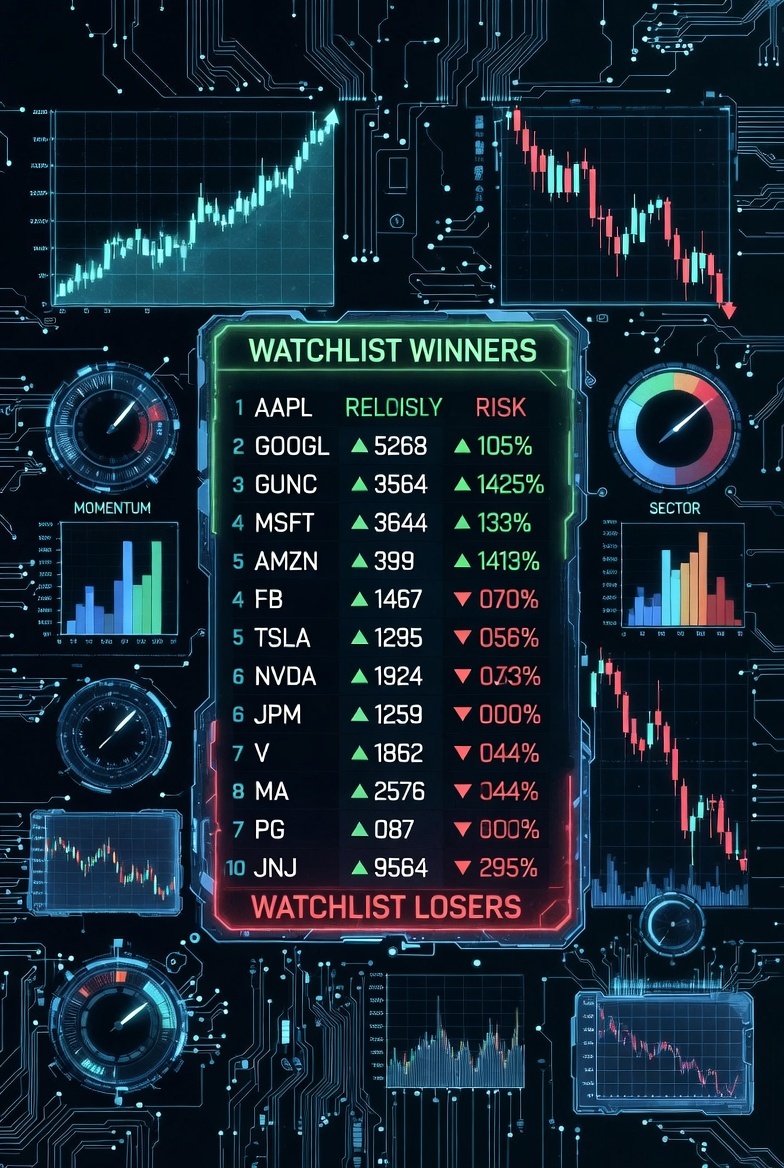
You get two clear, instantly visible master metrics:
- Reason Score (0–100) → Overall bullish conviction and probability of outperformance
- Risk Score (0–100) → Downside vulnerability, including relative weakness signals
Stocks with poor relative strength get penalized in the Risk Score — pushing them down the rankings or off the list entirely. Only the strongest setups (high Reason, low Risk) make the daily shortlist.
No more wondering if your holdings are secretly dragging you down. The AI flags relative weakness objectively and helps you rotate toward true leaders before it’s obvious to everyone else.
See Which Stocks Are Actually Strong Right Now
Want to know today’s highest-ranked names by relative strength — and which ones are carrying hidden risk?
→ Visit https://aistocktickers.com and check the live Top 10–20 rankings (no signup required for the daily leaders).
Clear out the losers in disguise. Focus on real strength.
Trade with an edge.
— The AIStockTickers Team
https://blog.aistocktickers.com
About AI Stock Tickers
AI Stock Tickers is a financial technology expert specializing in AI-driven market analysis and algorithmic trading strategies. With years of experience in quantitative finance, they provide insights into the intersection of artificial intelligence and financial markets.